Move fast, unbreak things: About the Sophos Active Adversary Playbook 2022
Credit to Author: Angela Gunn| Date: Tue, 07 Jun 2022 11:16:50 +0000
The Sophos Active Adversary Playbook 2022 dropped today. Our Rapid Response team does not enjoy looking back – after all, in each of the 144 incidents there was some degree of potential trauma and loss for a business, nonprofit, or government agency – but it’s crucial analysis to ensure we understand how attackers’ techniques ebb and flow over time and how they’re applying new pressures. That said, we’ve certainly learned from the incidents covered in the analysis; it’s our hope that readers can as well.
What do we know now that we learned by putting out twelve dozen fires in 2021? The Playbook itself is available in this blog post, but we thought we’d flag a few interesting points:
Dwell Time’s Up; Here’s Why
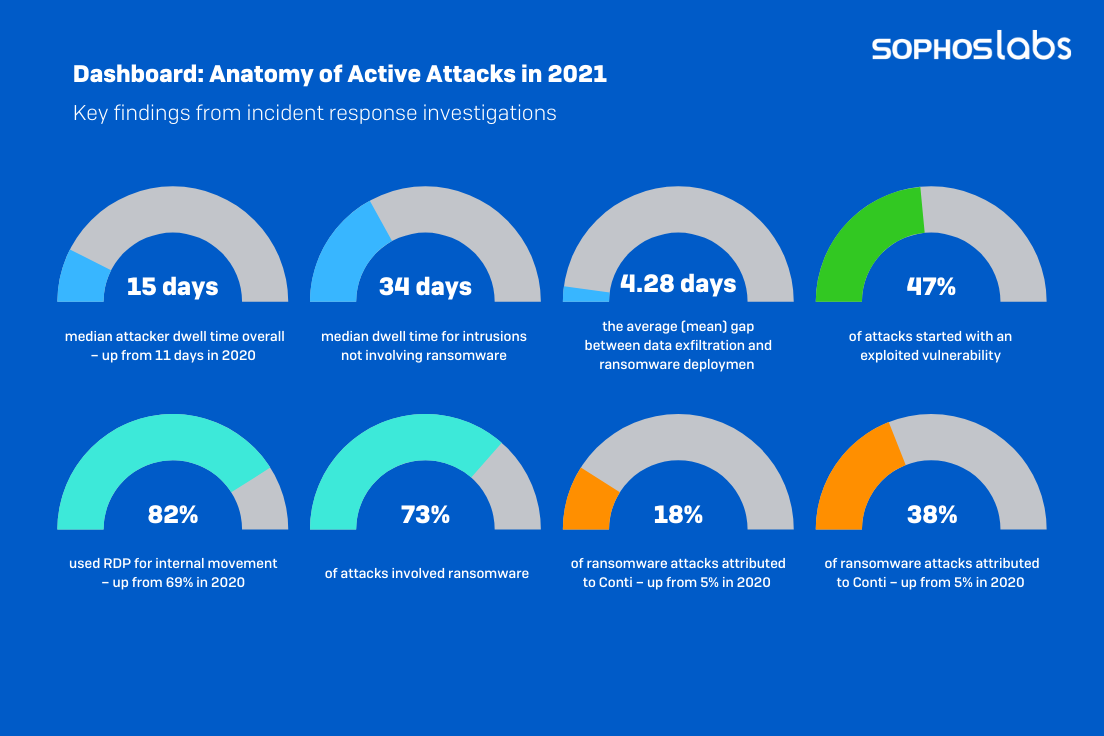
Our statistics show a 36 percent increase in adversary dwell time – a median of 15 days now, up from 11 days in 2020. It’s even worse for the little guy; on average, customers with 250 employees or fewer hosted unwanted “guests” for approximately 51 days. (Though it can certainly get worse.) Our analysis suggests that this is a knock-on effect of the rise of initial access brokers (IABs), whose business model hinges on getting access to vulnerable systems, quietly maintaining access to and exploring the systems to determine their potential worth to other criminals, and then selling that access to their clients.
Figure 1: Attacks in 2021, from the Sophos Active Adversary Playbook 2022
Interestingly, ransomware is – or should be – a smash-and-grab countervailing influence on dwell-time numbers. Our analysis found that dwell time for ransomware attackers has actually decreased over the past year, moving from an average median of 18 days down to 11. But though ransomware still accounts for a depressing 73 percent of the incidents in our survey (and half of those led in turn to data exfiltration), other forms of bad behavior still exist, and most of those rely on longer dwell time. In addition to the IABs noted above, cryptominers and the more traditional data-exfiltration attackers (that is, those without a ransomware component) all benefit from lingering in a system.
We should point out that not only are attack types not mutually exclusive, we saw a number of compromised systems that were hosting multiple infections and attackers. One system had dueling ransomware gangs at play. Another had a ransomware infection side-by-side with two different cryptominers. It’s less likely that these chaotic playgrounds were access-mediated by an IAB and more likely that they were simply open to whoever found them.
Attack of the Proxy Twins
And what were the root causes of all this trouble? Our analysis found a remarkable number of incidents connected to ProxyLogon and ProxyShell, the two vulnerabilities in Microsoft Exchange announced in, respectively, March and April 2021. This wasn’t terribly surprising; the CISA and other organizations have reported extensive exploitation of the two vulnerabilities. As we progress through 2022, we’d watching intently to see how many “stealth” infections are out there, providing persistent access to bad actors and aiming to raise 2022’s dwell-time number even higher.
The way to combat this, of course, is patching – consistent, rapid patching whenever possible. Unpatched vulnerabilities accounted for very nearly half (47%) of root causes over 2021, dwarfing all other known root vectors. Even phishing, compromised credentials, and tainted downloads – surely the ugly trinity of bad user behaviors – all together accounted for under 15 percent of traceable root causes. Perhaps 2022 is the year infosec professionals decide that maybe, just maybe, end users aren’t the worst threat to network security?
Scary Warez and Abused Tools
The investigations in our survey found 525 different artifacts in play on those 144 systems – 209 legitimate or attack-specific tools, 107 Microsoft-specific tools or binaries, and 209 assorted tools and techniques, some highly crafted to specific targets.
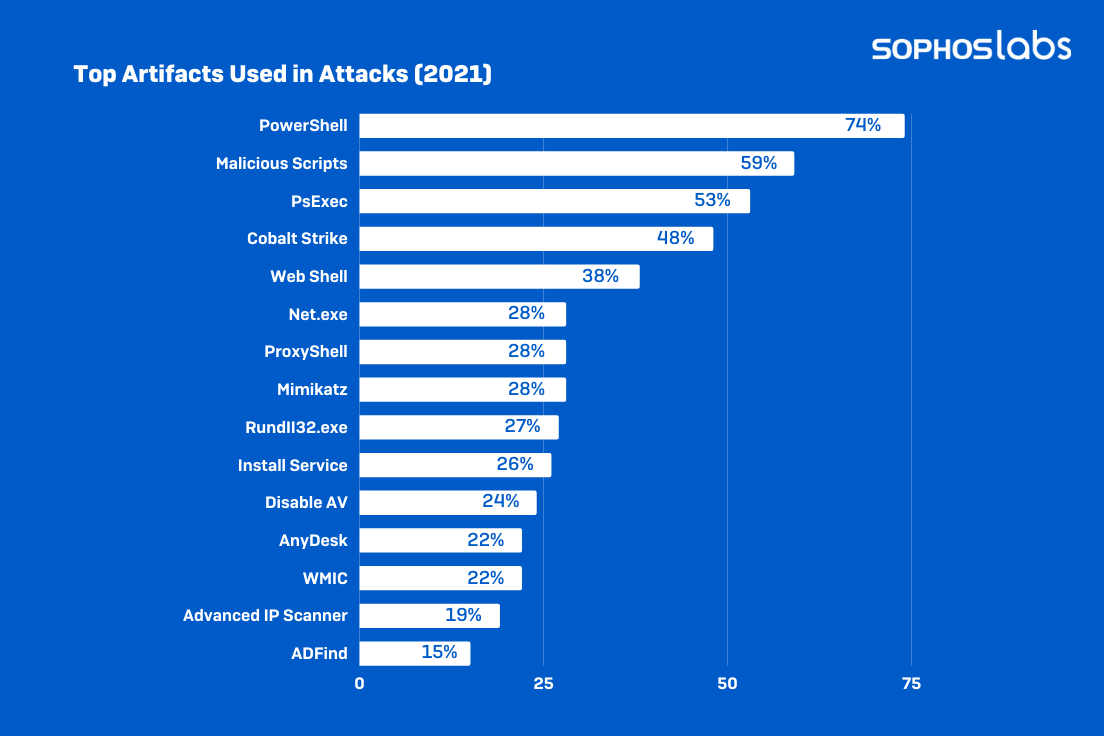
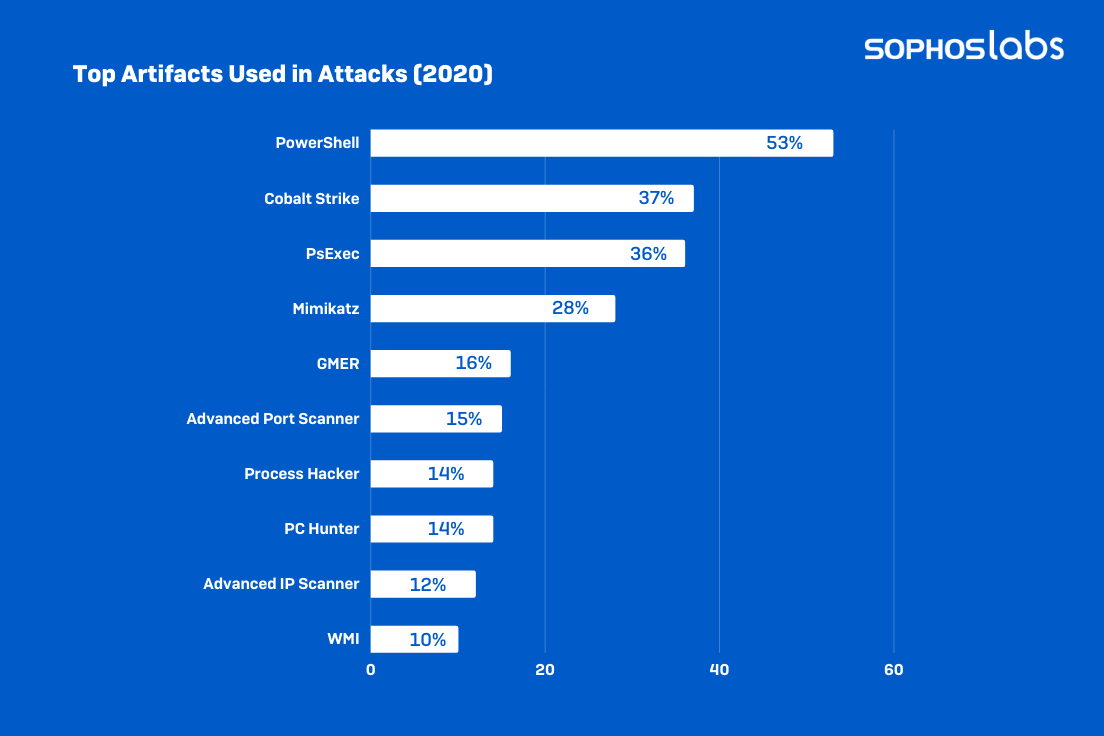
Figures 2 and 3: Attack-tool preferences in 2021 and 2020, from the Sophos Active Adversary Playbook 2022
Once again this year, the hands-down most popular tool used by attackers was Microsoft PowerShell – an entirely legitimate tool, but nonetheless one deployed at some point in 74 percent of all attacks. More surprising was the new positioning of remote desktop services in 2021’s attacks. Though RDP’s role in attacks was barely diminished from 2020 (87% down from 90%), we saw a remarkable jump in the percentage of attacks that used RDP solely for internal access and lateral movement – 82%, up from 69% just a year before. That’s a noteworthy change for defenders looking for unusual activity on their networks. On the other hand, RDP for external access has fallen off a cliff. Attackers used RDP for both internal and external access just 12% of the time, and just 1% of attackers used it solely for external access.
PowerShell and RDP are, again, legitimate tools, and to defenders it can occasionally seem as if they too often have to explain to clients that simply deleting PowerShell is not the way to rescue their networks. The more useful way of looking at tools remains combinations – spotting patterns of tool use that may indicate bad behavior. Our analysis flagged a number of combinations that should get the attention of defenders keeping an eye on their networks:
- PowerShell + malicious non-PS scripts (64% of 2021 cases)
- PowerShell + Cobalt Strike (56%)
- PowerShell + PS Exec (51%)
- PowerShell + malicious non-PS scripts + Cobalt Strike (42%)
- PowerShell + malicious non-PS scripts + PS Exec (38%)
- PowerShell + Cobalt Strike + PS Exec (33%)
- Cobalt Strike + Mimikatz (16%)
The Sophos Active Adversary Playbook 2022 is based on 144 incidents in 2021, targeting organizations of all sizes, in a wide range of industry sectors, and located in the U.S., Canada, the U.K., Germany, Italy, Spain, France, Switzerland, Belgium, Netherlands, Austria, the United Arab Emirates, Saudi Arabia, the Philippines, the Bahamas, Angola, and Japan. The most represented sectors are manufacturing (17%), followed by retail (14%), healthcare (13%), IT (9%), construction (8%), and education (6%). The full report can be viewed here.


